Monthly Archives: April 2024

Astoria Investments – Results Note – Discount Appears too Wide

Share Code: ARA – Market Cap: R498m – Discount to NAV: 42%

FY 23 Results: A Mixed Bag of Results

  • Astoria’s USD Net Asset Value (NAV) felt pressure and slipped marginally to $0.7947 per share (FY 22: $0.8266 per share), though the Rand NAV was slightly up at 1454cps (FY 22: 1406cps) as the Rand weakened over the period.
  • A decline in diamond prices was a headwind on diamond interests, loadshedding hurt Goldrush’s LPM performance & Leatt’s share price followed its sales down over an extra-ordinary trading period.
  • On the other hand, Outdoor Investment Holdings (OIH) traded (really) strongly (see relative sales performance below), ISA Carstens saw +10% enrolment growth & Vehicle Care Group (VCG) is proving its model nicely.

Commentary: Conservative NAV & Upside Optionality

  • Other than valuing A-Tec in OIH separately as a Norwegian asset and lifting ISA Carsten’s Academy multiple from 6.0x to 7.0x (but it remains well below other listed educational stock multiples), Astoria’s unlisted valuations remain largely consistent with history and, arguably, conservative.
  • A FY 24E normalisation in diamond prices & in Leatt Corp’s trading environment could point to upside in Astoria’s NAV (Leatt & diamond interests are a third of the Group’s NAV).

Valuation, 12m TP & Implied Return: Above Average Discount

  • Updating Astoria’s NAV to current prices, the share is trading at an above-sector-average c.42% discount to current NAV (Previously: 34%) despite its strong growth in NAV (+32.4% y/y CAGR in Rand-NAV since management took over on 1 December 2020)
  • If we take out our calculated “HoldCo discount” of c.13.9% (Previously: 15.0%) from this NAV, we arrive at a fair value for Astoria’s shares of c,1192cps (Previously: 1152cps) or c.49% higher than the current share price.
  • Rolling this fair value forward at our Cost of Equity, we arrive at a 12m TP of c.1420cps (Previously: 1365cps) which implies a potential return of c.77% from the current share price.

Sabvest Capital – FY 23 Results – NAVigating a Challenging Period

Share Code: SBP – Market Cap: R2.7bn – Dividend Yield: 1.3%

FY 23 Results: Rare period of pressure

  • Sabvest saw its Net Asset Value (NAV) per share slip fractionally lower to 10936cps (FY 22: 11017cps) as headwinds of higher inflation, higher interest rates and higher raw materials costs coincided with logistics challenges across the businesses held in its portfolio.
  • Most of the Group’s businesses performed good-to-well, though ITL Group & Halewood continued to trade through difficult respective structural and cyclical headwinds.
  • Management expects to resume satisfactory growth in NAV per share in FY 24, & we tend to agree.

Thoughts: Today’s Underperformers = Tomorrow’s Upside

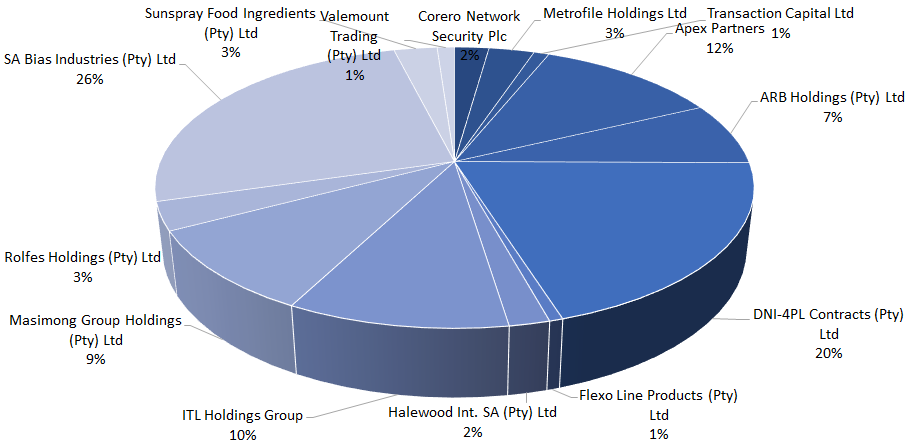
  • Over the last couple of years, ITL’s contribution to NAV has fallen from 20% to 10%, but the business (&, indeed, the entire global apparel sector) has restructured & could end up gaining from this period of disruption. Equity here is currently valued at zero but we suspect that this will not remain so & provides future upside optionality.
  • Likewise, Halewood’s current difficult trading period belies the value of the underlying that—in our opinion—management is valuing conservatively. As headwinds turn to tailwinds here, earnings should follow mix, & we see upside in this investment’s contribution to NAV too.
  • Finally, SA Bias is performing excellently & Apex, DNI, Valemount & Masimong all have healthy prospects.

Valuation, 12m TP & Implied Return: Wide discount to NAV

  • The share is currently trading at a c.37% discount to NAV.
  • Using our updated NAV (with the latest market prices) we arrive at a defendable (post-discount) fair value for Sabvest’s shares of 9817cps (previously: 10060cps), which still includes a HoldCo c.10% discount against this NAV.
  • Rolling our post-discount fair value forward, we see the Group’s 12m TP as 11675cps (previously: 11920cps) with an implied return of +69%.
  • See inside our report comparisons to some of the other JSE-listed HoldCo stocks.

Sabvest Capital: Breakdown of Group Net Asset Value (NAV)