Share Code: SBP – Market Cap: R2.7bn – Dividend Yield: 1.3%
FY 23 Results: Rare period of pressure
- Sabvest saw its Net Asset Value (NAV) per share slip fractionally lower to 10936cps (FY 22: 11017cps) as headwinds of higher inflation, higher interest rates and higher raw materials costs coincided with logistics challenges across the businesses held in its portfolio.
- Most of the Group’s businesses performed good-to-well, though ITL Group & Halewood continued to trade through difficult respective structural and cyclical headwinds.
- Management expects to resume satisfactory growth in NAV per share in FY 24, & we tend to agree.
Thoughts: Today’s Underperformers = Tomorrow’s Upside
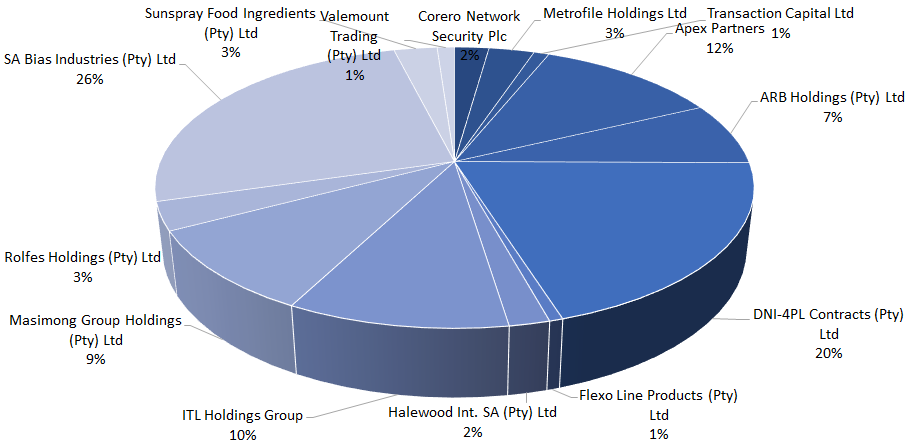
- Over the last couple of years, ITL’s contribution to NAV has fallen from 20% to 10%, but the business (&, indeed, the entire global apparel sector) has restructured & could end up gaining from this period of disruption. Equity here is currently valued at zero but we suspect that this will not remain so & provides future upside optionality.
- Likewise, Halewood’s current difficult trading period belies the value of the underlying that—in our opinion—management is valuing conservatively. As headwinds turn to tailwinds here, earnings should follow mix, & we see upside in this investment’s contribution to NAV too.
- Finally, SA Bias is performing excellently & Apex, DNI, Valemount & Masimong all have healthy prospects.
Valuation, 12m TP & Implied Return: Wide discount to NAV
- The share is currently trading at a c.37% discount to NAV.
- Using our updated NAV (with the latest market prices) we arrive at a defendable (post-discount) fair value for Sabvest’s shares of 9817cps (previously: 10060cps), which still includes a HoldCo c.10% discount against this NAV.
- Rolling our post-discount fair value forward, we see the Group’s 12m TP as 11675cps (previously: 11920cps) with an implied return of +69%.
- See inside our report comparisons to some of the other JSE-listed HoldCo stocks.
Sabvest Capital: Breakdown of Group Net Asset Value (NAV)

