Tag Archives: South Africa

Metrofile Holdings – FY 23 Results – Great Top-line Growth

Share Code: MFL – Market Cap: R1.3bn – PE: 9.3x – DY: 6.0%

FY 23 Results: Double-digit Organic Growth

  • Metrofile revenue grew per our forecasts at +16% y/y (+3% added via the consolidation of IronTree for the full period and, importantly, +13% of this growth was organic in nature) but EBITDA was slightly lighter than we expected at R345m (FY 22: R325m) as inflationary pressure, the full cost of the prior year’s established go-to-market team was carried and necessary IT upgrades were all carried in these results.
  • The Group bought back 10m shares, helping HEPS grow +5% y/y to 32.1cps (FY 22: 30.8cps) and the dividend was maintained at 18cps (FY 22: 18cps).

Our Thoughts: Two Large, Near-term Contract Wins Offer Upside

  • The Group’s MRM South Africa and MRM Middle East both won significant contracts during the period. While the South African one’s timing is hard to know (we have excluded it from our forecasts), the Middle Eastern contract should start generating revenue from the end of FY 24E (included in our forecasts from the start of FY 25E).
  • Note: These two contracts alone add c.+20% to Group annual revenues for the periods they occur, we cannot understate how significant they (and their timing) are to Metrofile’s next couple of financial years.

Forecast, Valuation and Implied Return: Inexpensive quality

  • We see Metrofile’s fair value as 423cps (previously: 426cps), implying an EV/EBITDA of 7.4x & a PE of 13.2x (comparing attractively to Iron Mountain’s current EV/EBITDA of 16.1x & PE of 47.8x).
  • Rolling our fair value forward, we arrive at a 12m TP of 500cps (previously: 496cps), implying an attractive c.65% return (including dividends) from these levels.
  • Given the fast growth in Digital Services over the period and the significant premium these businesses trade at in public markets, we are increasingly expecting some sort of inflection points in the coming years where Metrofile’s valuation starts to reflect the growing percentage of revenue coming from Digital Services.

Renergen – FY 23 Results – R5.7bn EBITDA on a market cap of R2.7bn?

Share Code: REN – Market Cap: R2.7bn – PE: -94.1x – DY: 0.0%

FY 23 Results: Producing Cash Flows from Phase One

  • With Phase One’s LNG production started ramping up during FY 23, Renergen produced its first Liquid Natural Gas (LNG) revenues of R12.7m (FY 22: R2.6) with R11.1m coming from LNG and the balance from the now closed CNH pilot plant (FY 22: zero from LNG & R2.6m from CNG).
  • Our FY 23 cost assumptions were too heavy, and we expected a full year loss of -22.3cps while the Group only actually lost -19.86cps (FY 22: -27.73cps).

Material Updates: A Coming Year of Big Events…

  • Phase One will spend FY 24E ramping up production, & it pivotally shifts Renergen from developer to producer status.
  • The Nasdaq listing process has started with management expecting its conclusion towards the end of this year. A circular to was released detailing the issuance of equity in two tranches; the first being 67.5m shares upon Nasdaq IPO raising c.$150m with the remaining tranche being raised towards the end of the Phase Two build. This is less implied dilution than we forecast & we have adjusted our view and SOTPs for this new data.
  • Management also published a revealing “Phase Two Guidance Note” forecasting FY 27E estimated EBITDA of between R5.7bn and R6.2bn per annum. Given that Renergen’s entire market cap is currently only R2.7bn, R5.7bn EBITDA is significant!

Valuation: SOTPs & Peer Relatives Higher Than Share Price

  • Updating and refining our forecasts, we see Renergen’s current fair value at c.6400cps (previously: 6233cps) and 12m TP as a little over 7500cps (previously: 7347cps).
  • Updating the crude listed helium peer relatives (market cap/helium), Renergen remains discounted against this measure. This remains true even if we take Phase Two’s future equity raises into account and despite Renergen being more advanced than its peers in both proving and starting to produce from its resource.

Sabvest Capital – FY 22 Results – Exciting Prospects

Share Code: SBP – Market Cap: R3.2bn – Dividend Yield: 1.1%

FY 22 Results: Better than Expected

  • Sabvest Capital’s NAV grew 17.6% y/y to 11017cps beating our expectations, the Group’s HEPS was firm at 1591.2cps (FY 21: 1689.7cps) and management has materially lifted the dividend to 90cps (FY 21: 75cps).This was a busy period with a range of new investments from ARB Holdings, Halewood to Valemount Trading.
  • The Group’s investee companies executed various underlying investments from Apex buying into DRA Global to SA Bias’ Flowmax acquiring YG Prefab in the UK.

Thoughts: Exciting Portfolio Prospects

  • While ITL’s may be the only duller spot in Sabvest’s portfolio (longer-term, though, we are very optimistic about this group’s prospects), DNI-4PL is firing all cylinders, SA Bias is performing strongly, and Apex Partners is fast growing into a material investment for the Group.
  • ARB Holdings is benefitting from the boom in solar, Halewood and Valemount Trading both hold immense potential for profitable expansion from their positions in the RTD/beverage and pet industries respectively.

Valuation, 12m TP & Implied Return: Cheap & Growing

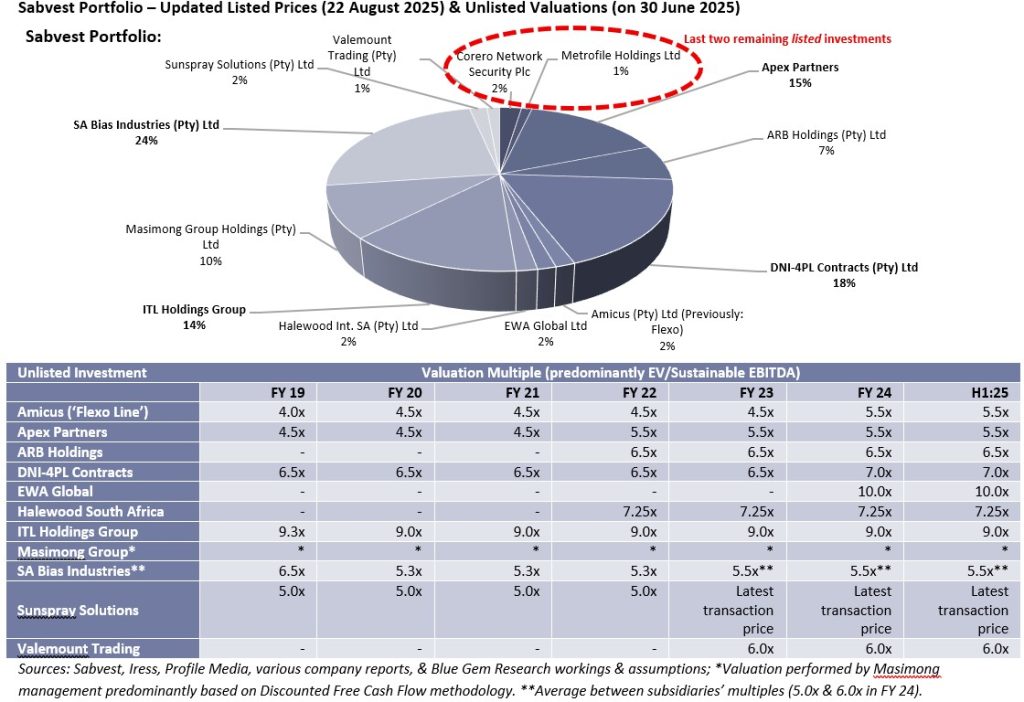
  • Updating the Group’s NAV for the latest market prices we arrive at a defendable (post-discount) fair value for Sabvest’s shares of 9227cps (previously: 8894cps), which still includes a HoldCo c.14.5% discount against this NAV.
  • Importantly, the underlying NAV appears to be conservatively valued and management’s track record for growth is well above average. These two factors combine favourably to form the Group’s investment appeal, particularly when offered at a discount (we estimate the share price currently offers a c.25% discount to NAV).
  • Rolling our post-discount fair value forward, we see the Group’s 12m TP as 10906cps (previously: 10511cps) with an implied return of +35%, excluding dividends.

Renergen – H1:23 Results – Share Price Disconnected from Underlying

Share Code: REN – Market Cap: R3.7bn – PE: -105x – DY: 0.0%

H1:23 Results: Delayed but moving swiftly forward

  • Renergen’s revenue was flat at R1.2m and the Group reported a loss of -19.31cps (H1:21 -21.05cps) as it neared production status.
  • Phase One is moments from producing gas and, although delayed against the original timeframe, this will be an exciting moment as the Group transitions from a developer to a producer.
  • Phase Two funding is progressing well, having issued shares to Ivanhoe Mines (though the larger equity deal expired), the CEF has agreed to inject R1bn into the Project, & various blue chip debt funders have expressed interest in funding up to $1.2bn of debt for the project.

Our Thoughts: Enviable Position

  • While Phase One delays are disappointing, the underlying fundamentals and attractive economics of the Virginia Gas Project remain and are further highlighted by the interest in funding Phase Two.
  • The conclusion of the well-priced CEF R1bn equity investment is a strong positive and, we believe, the expiry of the Ivanhoe equity deal is a net positive by avoiding expensive dilution.
  • Furthermore, the large pool of interested debt funders into Phase Two means that Renergen has both time to find the appropriate equity funding and the flexibility to pick terms.
  • All in all, we believe that Renergen is in an enviable position for a developer as it transitions into a fully-fledged gas producer.

Valuation and Implied Return: Share Price Disconnected from Value

  • We see Renergen’s fair value at c.6700cps (previously: 6337cps) and 12m TP c. 8000cps (previously: 7491cps).
  • With a range of fair values from c.5000cps to c.6700cps (CEF deal implies c.6600cps for REN shares), what is clear is that REN’s share price deviates substantially from even the low-end of this range.

Sabvest Capital – H1:22 Results – Better than Expected

Share Code: SBP – Market Cap: R2.9bn – Dividend Yield: 1.0%

H1:22 Results: Better than expected

  • Sabvest’s Net Asset Value (NAV) grew +10.9% p/p and +26.1% y/y to 10388cps (FY 21: 9371cps) driven by strong performances almost across all its investments that beat our full-year estimates.
  • The Group concluded investments in ARB Holdings and Halewood International South Africa during the period.
  • Despite this investment activity, the Group received good dividend flows, remains relatively lowly geared and management has declared a +50% y/y growth in dividend to 30cps (H1:21 – 20cps).

Thoughts: H1:22 growth likely to continue in H2:22E

  • ARB Holdings and Halewood are currently being carried at cost. While we expect operational growth in ARB to carry this investment value upwards, Halewood’s investment price appears quite conservative, and we expect both operational and re-rating to lift this valuation going forward.
  • Likewise, DNI-4PL, Masimong & Apex are all growing quickly, ITL Holdings’ global group has recovered strongly and SA Bias’ Flowmax appears to be on the front foot for acquisitions.
  • Finally, coupled with Sabvest’s superb capital allocation, relatively lowly-geared centre and its ability to buy-back its own shares below NAV, and it is likely that the good growth rate in H1:22 carries comfortably into H2:22E (and beyond).

Valuation, 12m TP & Implied Return: Lots of value available

  • Updating the Group’s NAV for the latest market prices & taking out our present valued “HoldCo discount”, we arrive at a defendable (post-discount) fair value for Sabvest Capital shares of 8894cps (previously: 7487cps) or +22% higher than the current share price.
  • Rolling this fair value forward at our Cost of Equity, we see the Group’s 12m TP as 10511cps (previously: 8825cps) with an implied return of +44%.

Refer to our Initiation of Coverage for more background.

Renergen – Key Due Diligence Is Successful

Share Code: REN – Market Cap: R4.6bn – PE: -124x – DY: 0.0%

Central Energy Fund: Due Diligence Successful, Fair Value Implied

  • Following Ivanhoe Mines’ option expiring (see our previous note), questions surfaced about the reason for this expiry &, indeed, whether it involved the quality of the Virginia Gas Project (VGP).
  • Concurrent to Ivanhoe’s deal, Renergen was fielding a due diligence (DD) by the Central Energy Fund (CEF) for a 10% stake in VGP for R1bn. This DD has successfully concluded and both parties are now seeking final approvals to complete the transaction.
  • This is an important event for at least three reasons:
    1. The positive DD by CEF confirms the quality of the VGP,
    2. Assuming final approvals are received, this injects R1bn of equity funding into the Phase II funding, &
    3. This solidifies an arms-length R10bn valuation for VGP (i.e. if 10% is worth R1bn, 100% is worth R10bn).

Our Thoughts: Much Better Price + Less Dilution

  • Above, point (3) implies that REN’s 90% stake is worth R9bn or c.6660cps (= R9bn/135.1m shares) versus our previous fair value of 6337cps & the share’s current market price of 3460cps.
  • Ivanhoe’s option would have come in at a discount to the current market price (if exercised) &, thus, the CEF’s deal is a lot less dilutive for shareholders and ensures a much large proportion of the eventual VGP value likely accrues to existing shareholders.

Valuation and Implied Return: Unchanged

  • We are currently reassessing our valuation and model for REN and will publish this in due course.
  • Despite that & due to the CEF deal—assuming no deterioration in exchange rates, commodity prices or interest rates—we believe that the previously communicated valuation at least guides towards a floor value of the Group. Previously, we saw REN’s fair value as around 6337cps & 12m TP of about 7491cps.

Renergen – Funding (Almost) Secured

Share Code: REN – Market Cap: R5.0bn – PE: -139x – DY: 0.0%

Phase 2 Debt Funding: Quantum Points to Larger Phase 2

  • Renergen has signed a Retainer Letter with the US International Development Finance Corporation (DFC) for Phase 2 debt funding of up to $500m. The DFC provided debt of $40m in Phase 1.
  • Added to this, Renergen has received multiple Letters of Intent to co-lend alongside the DFC of up to $700m in senior debt.
  • The lenders are currently conducting a due diligence to finalize their offers &, assuming a positive outcome, it leaves Renergen in the envious position to pick and choose its debt funding.
  • These lines of debt are up to $1.6bn in potential funding that—when combined with potential equity funding from Ivanhoe Mines & the CEF—points a clear path to a fully-funded Phase 2.
  • Renergen is now targeting 65% gearing & the implications of the amounts are that Phase 2 will be materially larger than originally envisioned; we originally assumed a c.R12bn capex cost for Phase 2, but the above figures imply >R15bn – Gas projects tend to get returns to scale & a c.25% larger size may produce >25% more gas.
  • If we assume a c.$1bn Phase 2, & Ivanhoe (capped to c.$250m) & CEF (c.R1bn) both follow through for their equity and Renergen management draw down on their debt with a 65% gearing (drawing c.$650m), this implies that there remains equity funding of c.$45m or c.R700m (c.1-for-10 rights issue at current prices).

Valuation and Implied Return: Updated for latest spot prices

  • While Phase 2 size is rising, output upgrades & the Ivanhoe & CEF equity needs to be pinned down for us to correctly model. These are large variables and, currently, still have conditions outstanding.
  • For now, we have kept the size of Phase 2 flat (which creates upside risk to our valuation and forecasts), assumed debt is drawn down at the end of FY 23E (but interest capitalized until FY 25E), Ivanhoe & CEF follow their full equity rights, 11.5m REN shares are placed during FY 23E (1-for-10 rights issue), & Phase 2 production starts during FY 25E (9 months) with steady-state in FY 26E (albeit, we have used flat spot prices as based on the current basket, ArgHe token price and exchange rates).
  • This produces a fair value of 6337cps (previously: 6344cps) & 12m TP of 7491cps (previously: 7501cps).

Trellidor Door Holdings – H1:22 – Series of Unfortunate Events

Share Code: TRL – Market Cap.: R267m – PE: 7.9x – DY: 3.9%

H1:22 Results: Riots, Strike, Shortages & Curveballs…

  • The riots in July & the metalworkers strike (c.12% lost production time in Trellidor) combined with stock shortages in the Taylor to hurt sales & pressure margins.
  • Despite losing an estimated c.R25m of turnover & c.R12m of EBITDA to these unfortunate events, Group revenue managed to be maintained at R284m (H1:21 – R282m).
  • Gross margin contracted to 40.1% (H1:21 – 44.6%), EBITDA fell to R46.5m (H1:21 – R57.8m) & HEPS contracted to 25.4cps (H1:21 – 30.6cps).
  • As a final curveball, a contingent liability has manifested in the form of an adverse labour judgement being upheld. We have assumed an R29m one-off expense in H2:22 due to this & management have skipped their dividend in anticipation of having to fund this drawdown.

Our Thoughts: Better H2:22 Likely

  • We expect that in H2:22E, the acquisitions in Trellidor Retail, the full-period consolidation of the UK, the maintenance of full production in the factories and more aggressive price increases are all likely to see some of the H1:22 underperformance clawed back.
  • Despite this, recent raw material price spikes (from Russia-Ukraine) & supply chain disruptions (from China’s latest COVID outbreak meeting its zero COVID policy) put this view at risk.

Forecast, Valuation & Implied Return: Worth > 400cps

  • Our DCF Models imply that Trellidor is worth c.469cps (previously: 548cps) on a PE of 13.2x & EV/EBITDA of 7.3x.
  • Our Relative Valuation implies a fair value of 411cps (previously 470cps), which does not agree with the above DCF. Despite this, both models indicate a fair value for Trellidor at least greater than 400cps (well above the current 285cps share price).
  • Rolling this DCF SOTP fair value forward we arrive at a 12m TP of 580cps (previously 656cps) implying a total return of c.103%.

Renergen – Government Investor Highlights Virginia’s Value

Share code: REN – Market Cap.: R5.1bn – PE: -114x – DY: 0.0%

News: South African Government invests directly

  • South Africa’s Schedule 2 state-owned diversified energy company, Central Energy Fund (CEF), has signed a non-binding term sheet to invest R1bn into Renergen’s wholly-owned subsidiary that houses the Virginia Gas Project, Tetra4, in exchange for new shares equalling 10% of Tetra4 being issued.
  • The agreement leaves 141 days for the CEF to complete a due diligence, get necessary approvals, & sign a binding legal agreement with Renergen. This period can be extended & Renergen has the option to renegotiate the price.

Our Thoughts: Adds momentum, derisks further & implies fair value

  • This deal adds further momentum to the direct investment into the Group by Ivanhoe Mines, further capitalizes Phase II and, more subtly, aligns this project’s success directly with domestic Government that somewhat politically & regulatory derisks it.
  • Management has confirmed that the CEF deal is backed by Ivanhoe Mines. Thus, it may add to the probability that Ivanhoe Mines will follow their remaining rights at Group-level.

Valuation and Implied Return: CEF price tag implies 6946cps

  • Given the proximately to our last note, we have not updated our fair value for Renergen and maintain it at 5821cps (previously: 5821cps) with a 12m TP of 6867cps (previously: 6867cps).
  • The R1bn price attached to 10% of Tetra4 implies a valuation of R9bn for the remaining 90% held by Renergen, or c.6946cps per issued REN share (=R9bn / c.129.5m issued shares).
  • While this implied valuation is only indicative (the CEF likely has different criteria for making/valuing investments than stock market minorities, the investment further derisks the project, & shareholding in a subsidiary does not take into account other Group assets nor HoldCo costs), it certainly highlights how undervalued Renergen’s shares potentially are.

Sabvest Capital – FY 21 – Great Performance with More to Come

Share Code: SBP – Market Cap: R2.4bn – Dividend Yield: 0.6%

FY 21 Results: Strong NAV growth, large hike in dividend

  • Sabvest’s FY 21 Net Asset Value (NAV) per share grew by +26% y/y to 9371cps (FY 20: 7444cps), adding to the Group’s fantastic track record as it has compounded NAV per share (excluding dividends) at +16.9% CAGR for a decade & a half!
  • Updating this NAV (keeping unlisted valuations flat), we see the current share as trading at a c.37% discount. This is despite JSE-listed HoldCo’s average discount-to-NAV being c.30%, and despite most of these other HoldCo’s having a worse track record than Sabvest. Using this peer-average discount, Sabvest shares should be trading closer to 7000cps.
  • Sabvest hiked its dividend to 75cps (FY 20: 25cps) as its balance sheet remains comfortably capitalized.

Thoughts: “Quality” growth in NAV, more likely to come…

  • As most of Sabvest’s investments are unlisted (c.86% of NAV), it is important to emphasise that the growth in NAV is not due to rising valuation multiples (all valuation multiples are flat from FY 20). The growth in NAV was driven by earnings growth &, therefore, we consider it “quality growth”.
  • As investee companies are trading at-or-better than 2019 pre-COVID levels, we expect continuing NAV growth in FY 22E.

Valuation, 12m TP & Implied Return: Lots of value available

  • Updating the Group’s NAV for the latest market prices & taking out our present valued “HoldCo discount”, we arrive at defendable (post-discount) fair value for Sabvest Capital shares of 7487cps (previously: 6826cps) or +19% higher than the current share price.
  • Rolling this fair value forward at our Cost of Equity, we see the Group’s 12m TP as 8825cps (previously: 8000cps) with an implied return of +40%.
  • All these measures exclude the potential upside from the ARB Holdings delisting, Apex’s Ascendis Medical deal & any Rand weakness going forward that will lift hard currency valuations.
  • Refer to our Initiation of Coverage for more background.